Insights
Comprehensive guide to blockchain analytics and monitoring with SettleMint's integrated explorers. Learn to track transactions, monitor smart contracts, and analyze network performance with Blockscout and Hyperledger Explorer.
For Development Teams: SettleMint's integrated blockchain explorers provide real-time transaction monitoring, smart contract debugging, and network analytics - reducing debugging time by 60% and improving application reliability.
Why do I need blockchain analytics and monitoring?
To view and inspect transactions in your blockchain application, SettleMint provides enterprise-grade dashboards via integrated blockchain explorers that enable:
- Real-time transaction tracking for immediate issue detection
- Smart contract debugging with detailed execution traces
- Network performance monitoring for optimization insights
- Compliance reporting for regulatory requirements
- User activity analytics for business intelligence
Blockscout Explorer
For EVM Compatible Networks (Besu, Polygon Edge)
- Complete transaction history and state inspection
- Smart contract verification and interaction
- Token transfer tracking and analytics
- Address-based activity monitoring
Hyperledger Explorer
For Fabric Networks
- Channel-specific transaction monitoring
- Chaincode execution tracking
- Peer and orderer performance metrics
- Organization activity analytics
How do I deploy a blockchain explorer for my network?
Navigate to the application where you want to add a blockchain explorer. Click Insights in the left navigation, and then click Add Insights. This opens a form.
Follow these steps:
- Select Blockchain Explorer
- Select the target blockchain node and click Continue
- Enter a name for your explorer instance
- Configure deployment settings (provider, region, size)
- Click Confirm to add the explorer
First ensure you're authenticated:
settlemint loginCreate blockchain explorer:
# Create blockchain explorer
settlemint platform create insights blockscout <name>

# Get information about the command and all available options
settlemint platform create insights blockscout --help
For a full example of how to create a blockchain explorer using the SDK, see the Blockscout SDK API Reference.
How do I monitor and maintain my blockchain explorer?
Navigate to your explorer and click Manage insights to:
- View explorer details and status
- Monitor health status
- Access the explorer interface
- Update configurations
Current status values:
DEPLOYING- Initial deployment in progressCOMPLETED- Running normallyFAILED- Deployment or operation failedPAUSED- Explorer is pausedRESTARTING- Explorer is restarting
Health status indicators:
HEALTHY- Operating normallyHAS_INDEXING_BACKLOG- Processing backlogNOT_HA- High availability issueNO_PEERS- Network connectivity issue
# List explorers
settlemint platform list services --type insights

# Restart explorer
settlemint platform restart insights blockscout <name>
// List explorers
const listExplorers = async () => {
const explorers = await client.insights.list("your-app");
console.log('Explorers:', explorers);
};
// Get explorer details
const getExplorer = async () => {
const explorer = await client.insights.read("explorer-unique-name");
console.log('Explorer details:', explorer);
};
// Restart explorer
const restartExplorer = async () => {
await client.insights.restart("explorer-unique-name");
};How do I analyze blockchain data effectively?
Pro Tip: Use the explorer's API endpoints to build custom dashboards and integrate blockchain data into your business intelligence systems.
When the blockchain explorer is deployed and running successfully, you gain access to powerful analytics capabilities:
Access Real-Time Dashboard
Open the web interface through the Interface tab for immediate network visibility
Analyze Transaction Patterns
View transaction flows, identify high-volume addresses, and track token movements
Monitor Smart Contract Activity
Inspect contract interactions, gas usage patterns, and execution success rates
Generate Compliance Reports
Export transaction data and create audit trails for regulatory requirements
Enterprise Analytics Features:
- Real-time transaction monitoring with configurable alerts
- Advanced search capabilities by block, transaction hash, address, or time range
- Smart contract verification and source code viewing
- Token analytics including transfers, holders, and distribution
- Network performance metrics showing TPS, block times, and gas usage
- API access for custom integrations and automated monitoring
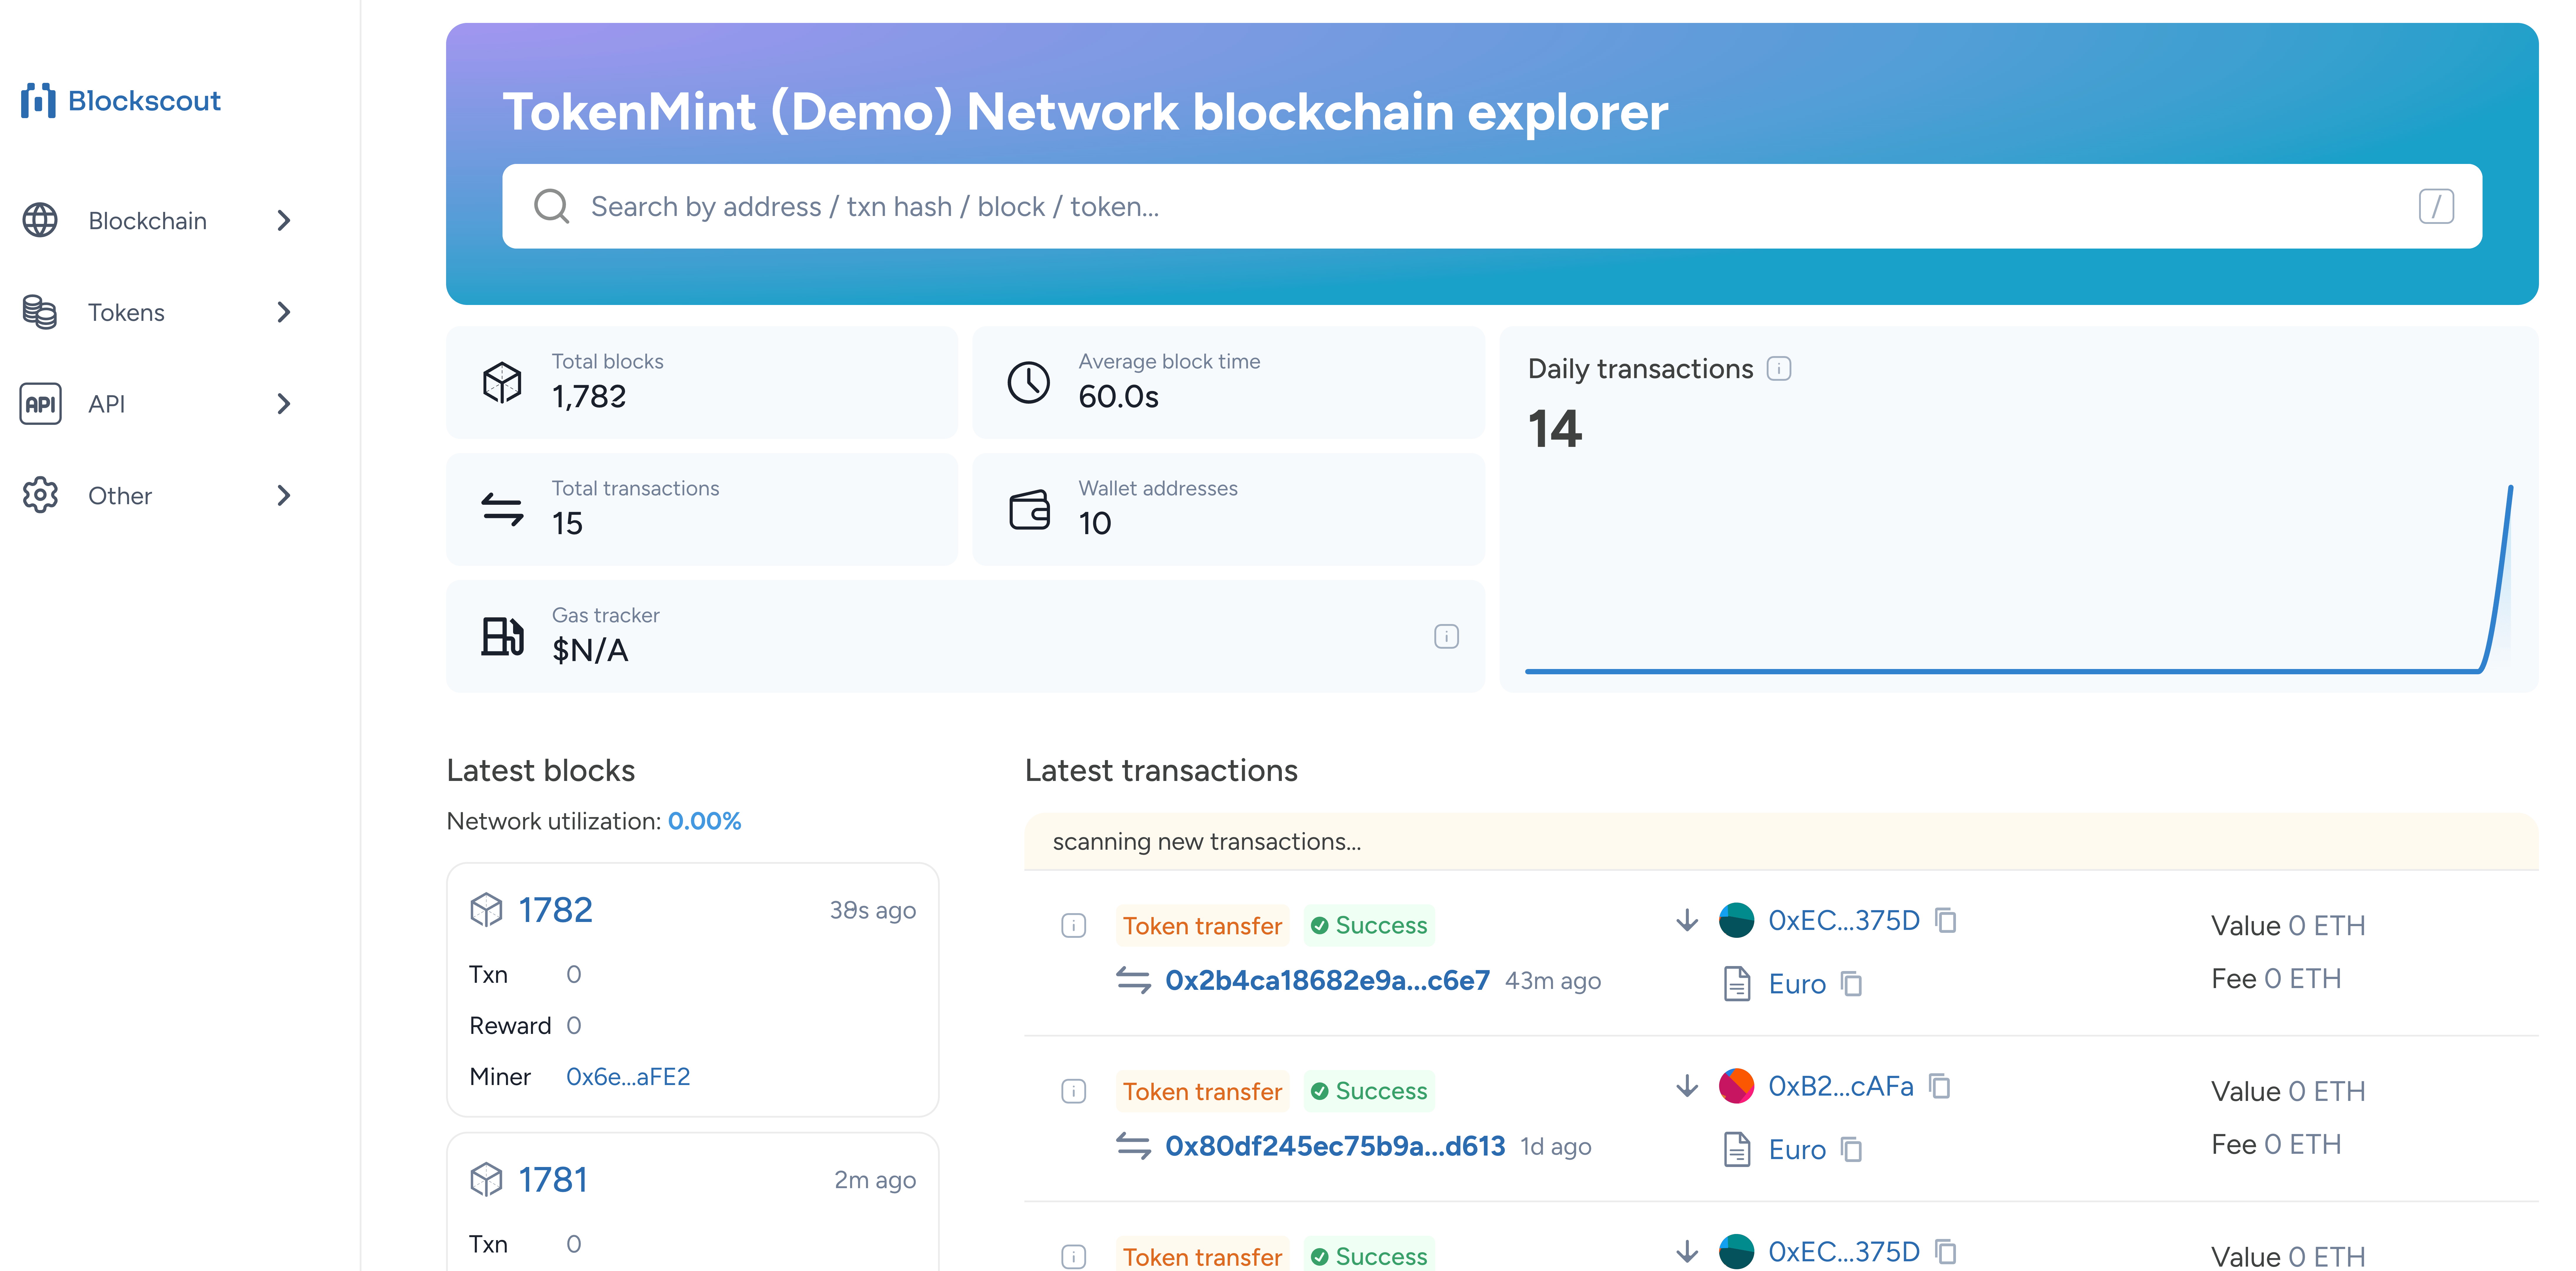
Transaction details
Click a Transaction hash to see detailed information including:
- Gas usage and fees
- Input data and events
- Status and confirmations
- Related addresses
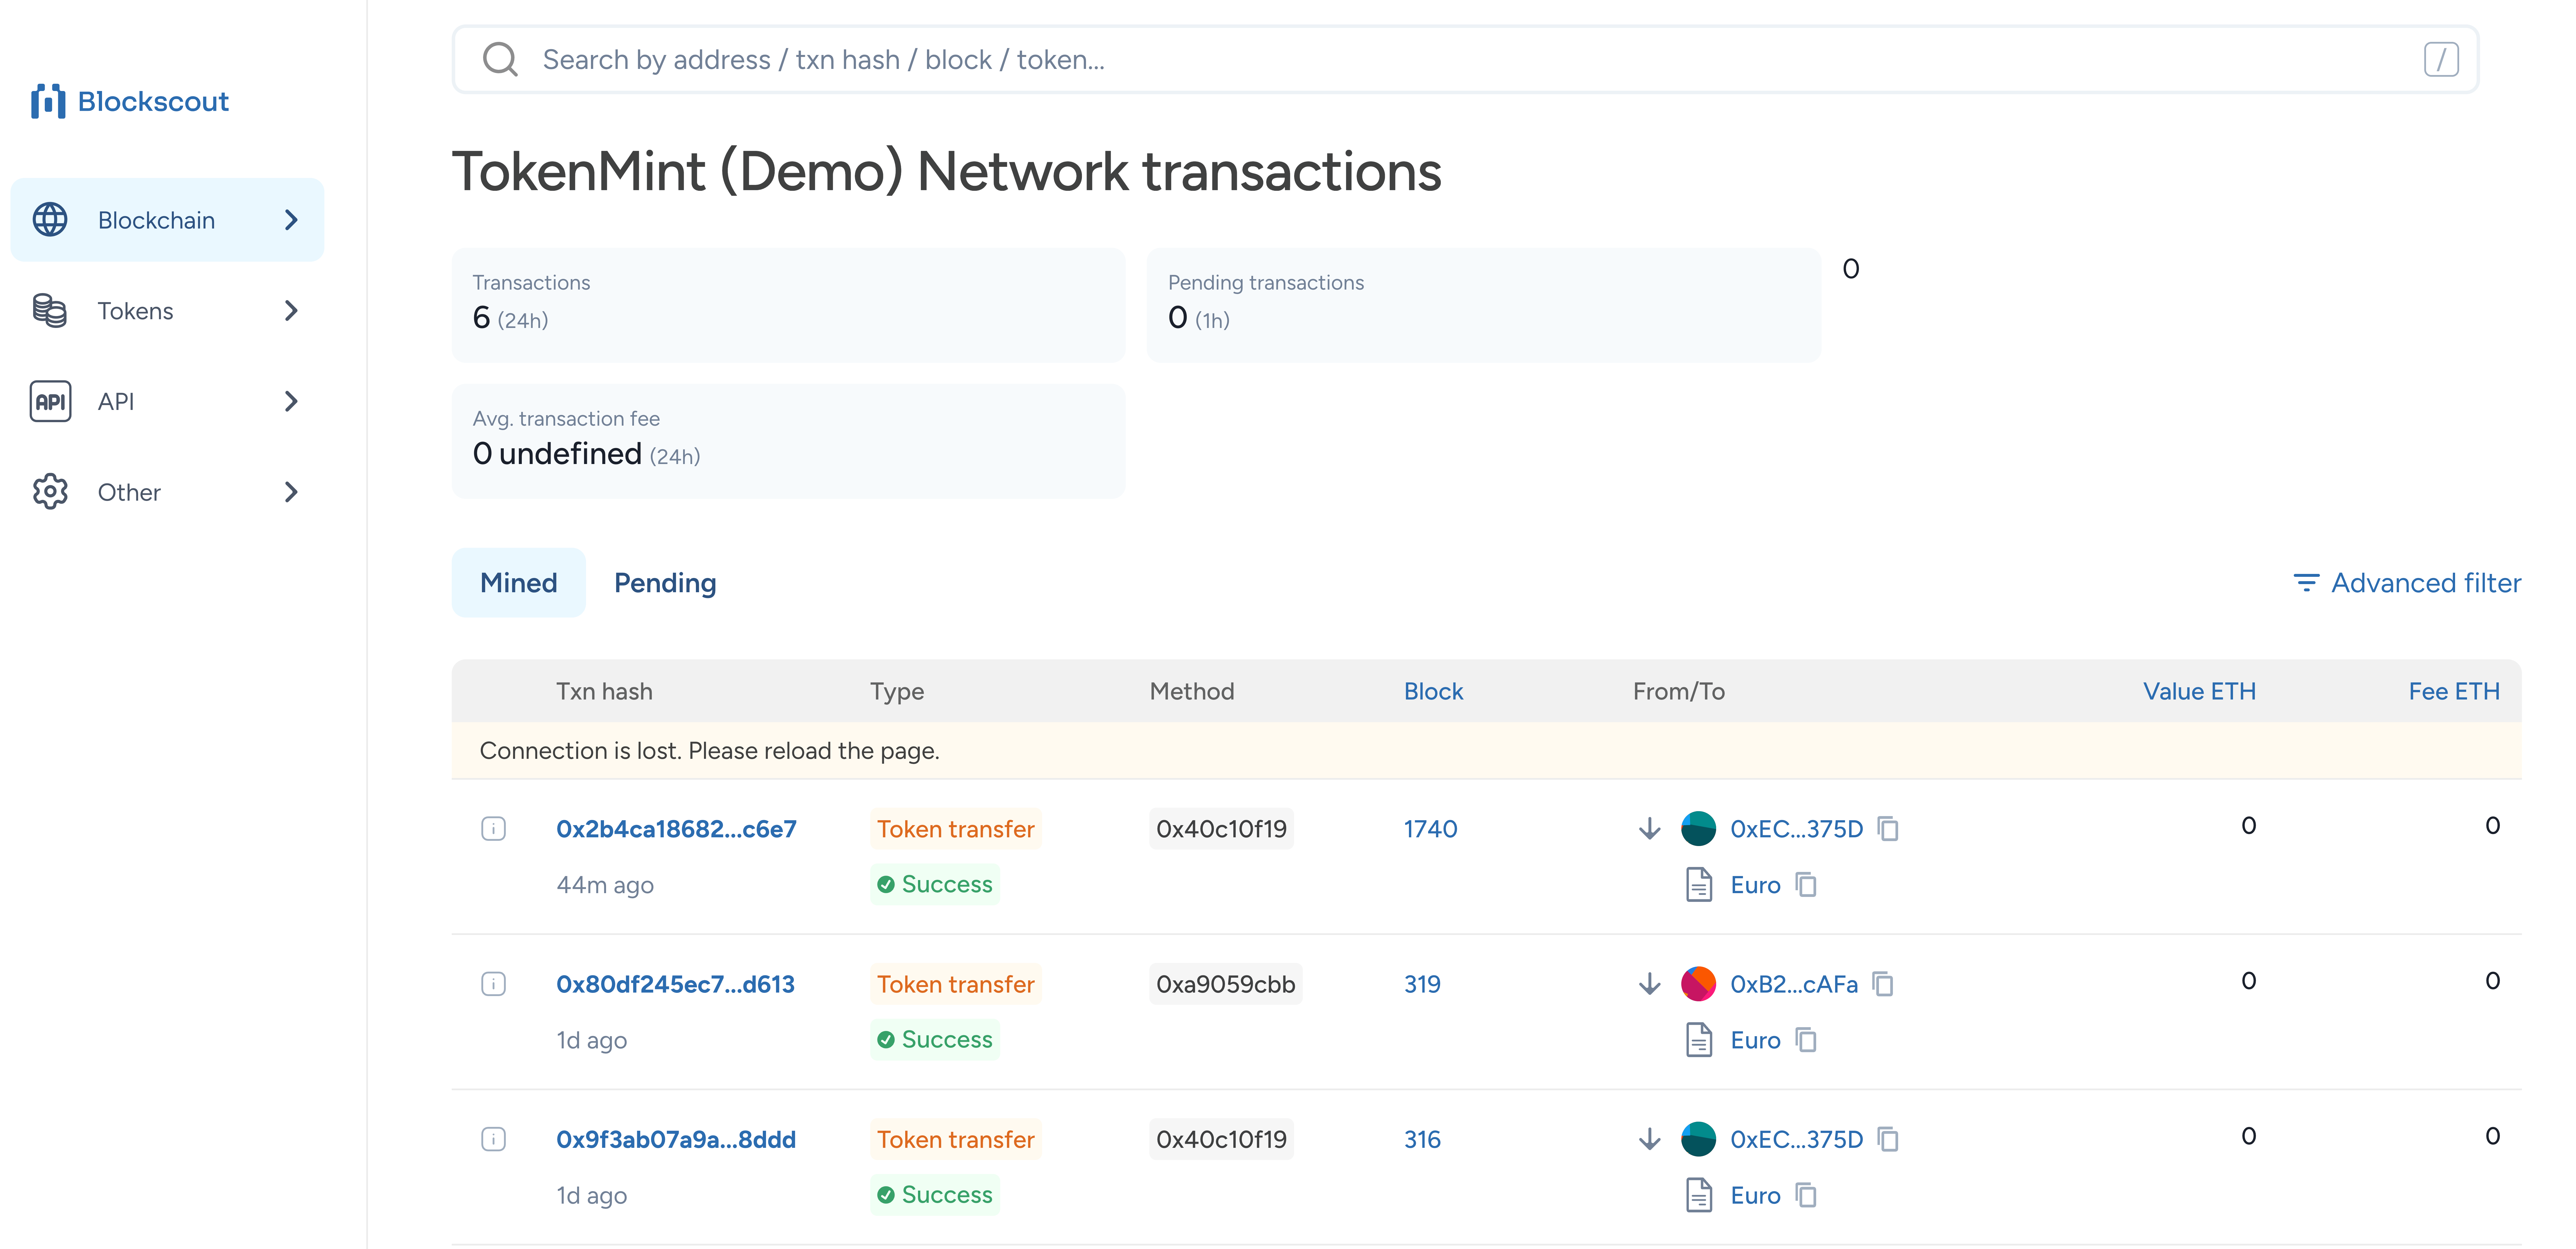
Address details
Click an Account address to view:
- Balance and token holdings
- Transaction history
- Contract interactions
- Analytics and graphs

All operations require appropriate permissions in your workspace.
Why choose Blockscout for EVM blockchain monitoring?
Enterprise Benefits: Blockscout provides production-ready blockchain analytics with 99.9% uptime, supporting thousands of transactions per second with real-time indexing and enterprise-grade security.
Blockscout is an open-source blockchain explorer optimized for Ethereum Virtual Machine (EVM)-compatible networks. For enterprises building on blockchain, Blockscout provides:
- Complete transaction transparency for audit and compliance requirements
- Real-time monitoring enabling immediate response to network issues
- Developer debugging tools reducing smart contract troubleshooting time
- Business intelligence data for understanding user behavior and network usage
- API integration capabilities for custom dashboard and alert systems
Designed for enterprise-scale visibility, Blockscout delivers structured access to on-chain operations, serving as a critical tool for developers, auditors, and system architects building production blockchain applications.
Transactions refer to standard on-chain actions initiated by externally owned
accounts (EOAs), like sending tokens, deploying contracts, or interacting with
smart contracts. These are recorded directly on the blockchain with their own
transaction hash.

Internal Transactions (also called “message calls”) are operations triggered
within smart contracts, often as a result of a transaction. For example, a
contract calling another contract or transferring ETH/token internally. These
are not standalone transactions but are captured through execution traces and
don’t appear directly on-chain.
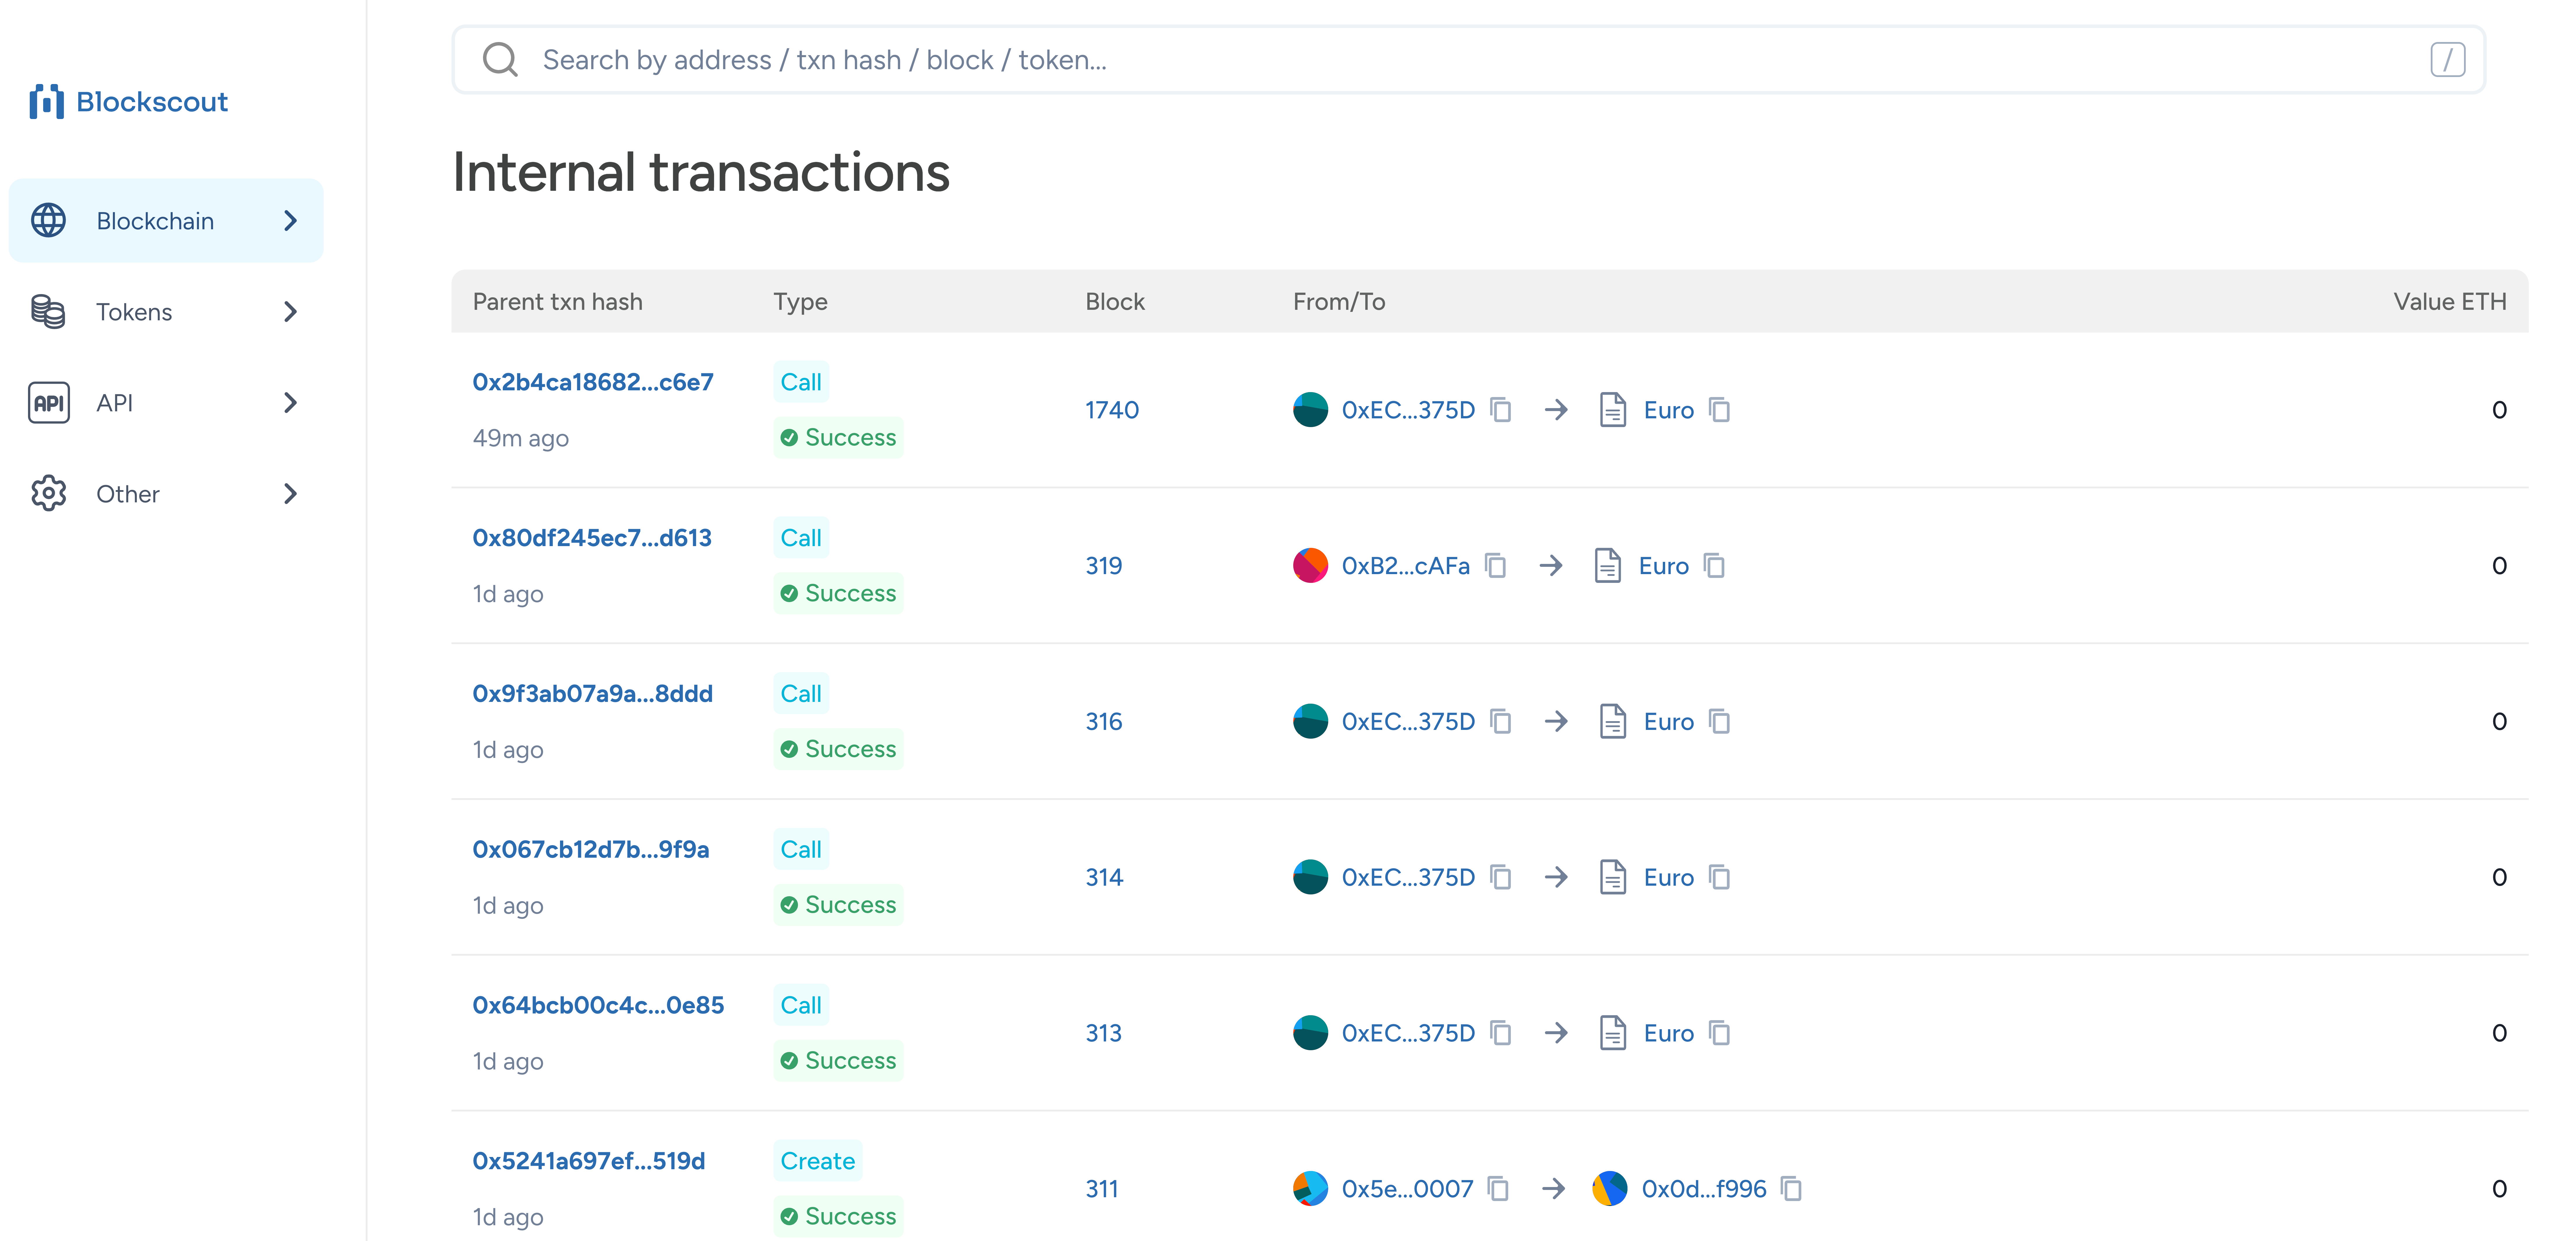
It enables precise interrogation of blockchain state through its block and transaction monitoring capabilities. Blocks are indexed by unique hashes or sequential numbers, exposing attributes such as block height, timestamp, gas consumption, and transaction volume. Transaction data includes sender and recipient addresses, transferred values, gas costs, and execution status (e.g., success, failure, pending). For smart contract interactions, Blockscout parses input data to extract function calls and parameters, providing developers with actionable insights for debugging and validation workflows. The explorer supports detailed address inspection for both externally owned accounts (EOAs) and smart contracts. Queryable data encompasses current balances, transaction histories, and token associations. For verified smart contracts, Blockscout exposes source code and Application Binary Interface (ABI), enabling direct interaction via the platform. This functionality supports use cases such as wallet tracking, address investigation, and contract deployment verification, making it an indispensable resource for EVM developers and security analysts.
Api overview
Blockscout provides multiple API interfaces to interact with blockchain data, including REST API, JSON RPC & ETH Compatible RPC Endpoints, and GraphQL. These APIs are designed for ease of use, supporting developers transitioning from other explorers like Etherscan to Blockscout, as well as those requiring general API and data support.
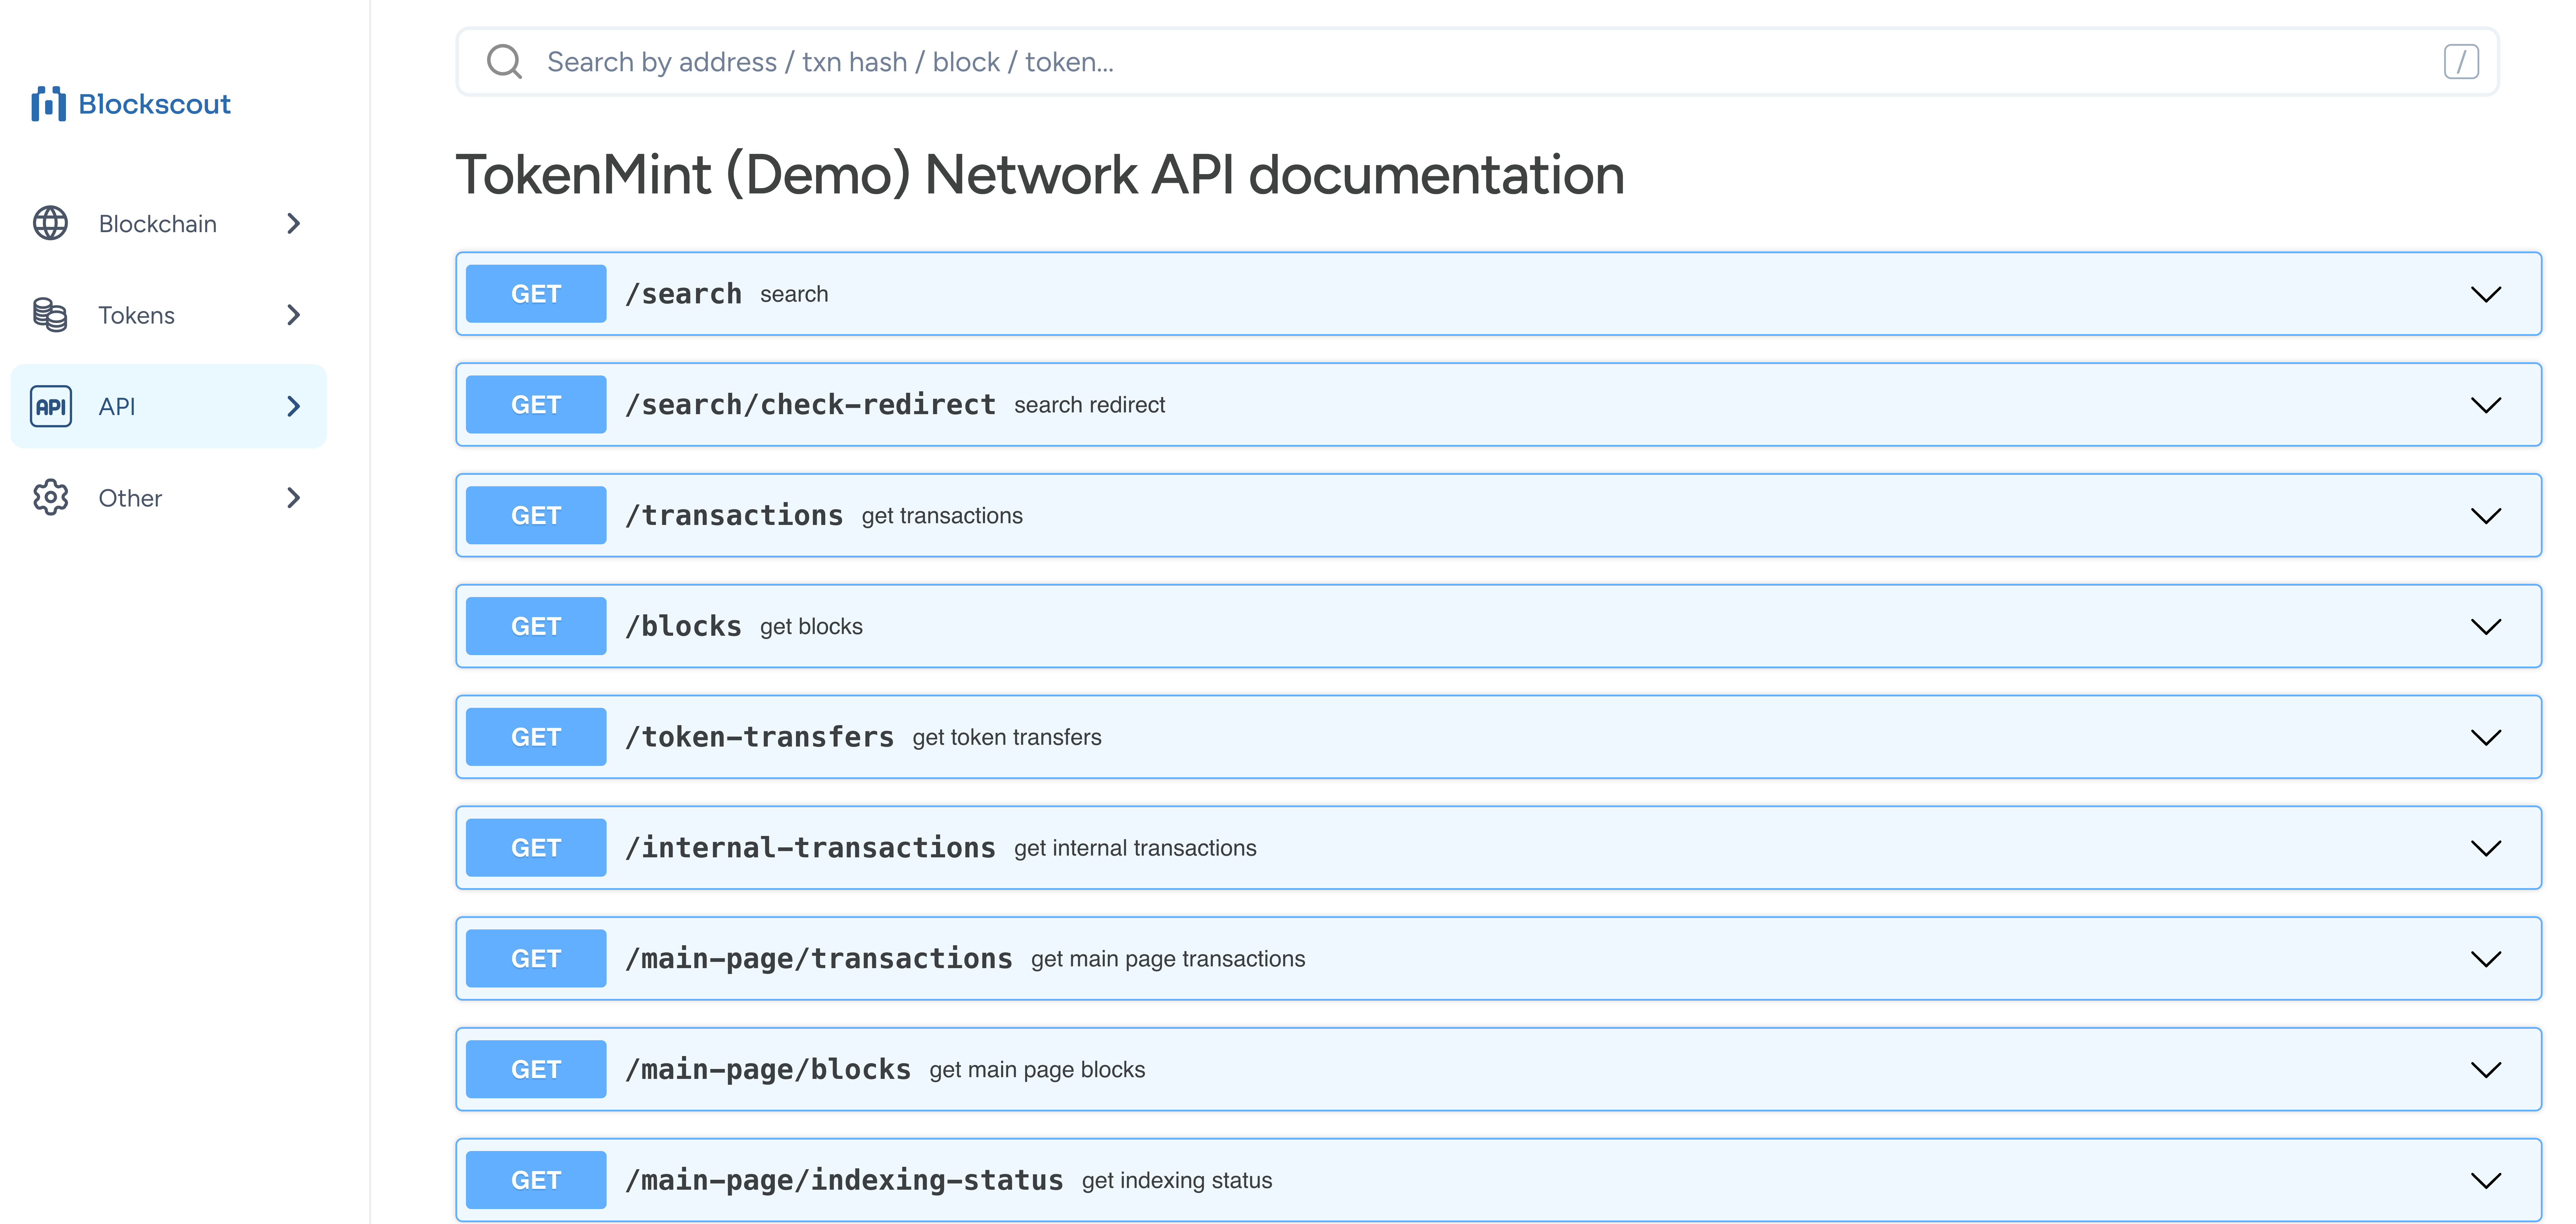
Api access
REST API URL: /api
JSON RPC URL: /api/eth-rpc
GraphQL URL: /graphiql
Rest api endpoints
The REST API supports both GET and POST requests and is structured around modules and actions. The following modules are supported: Account, Logs, Token, Stats, Block, Contract, and Transaction.
Search
GET /search                         # Perform a general search
GET /search/check-redirect          # Search redirect
Transactions
GET /transactions                                           # Retrieve transactions
GET /transactions/{transaction_hash}                        # Get transaction details
GET /transactions/{transaction_hash}/token-transfers        # Get token transfers for a transaction
GET /transactions/{transaction_hash}/internal-transactions  # Get internal transactions
GET /transactions/{transaction_hash}/logs                   # Get transaction logs
GET /transactions/{transaction_hash}/raw-trace              # Get transaction raw trace
GET /transactions/{transaction_hash}/state-changes          # Get transaction state changes
GET /transactions/{transaction_hash}/summary                # Get a human-readable transaction summary
Blocks
GET /blocks                                                 # Retrieve blocks
GET /blocks/{block_number_or_hash}                          # Get block details
GET /blocks/{block_number_or_hash}/transactions             # Get transactions in a block
GET /blocks/{block_number_or_hash}/withdrawals              # Get block withdrawals
Addresses
GET /addresses                                              # Get native coin holders list
GET /addresses/{address_hash}                               # Get address details
GET /addresses/{address_hash}/transactions                  # Get transactions related to an address
GET /addresses/{address_hash}/token-transfers               # Get token transfers
GET /addresses/{address_hash}/internal-transactions         # Get internal transactions
GET /addresses/{address_hash}/logs                          # Get logs related to an address
GET /addresses/{address_hash}/blocks-validated              # Get blocks validated by the address
GET /addresses/{address_hash}/token-balances                # Get all token balances
GET /addresses/{address_hash}/tokens                        # Get token balances with filtering and pagination
GET /addresses/{address_hash}/coin-balance-history          # Get coin balance history
GET /addresses/{address_hash}/coin-balance-history-by-day   # Get balance history by day
GET /addresses/{address_hash}/withdrawals                   # Get withdrawals related to an address
GET /addresses/{address_hash}/nft                           # Get list of NFTs owned by an address
GET /addresses/{address_hash}/nft/collections               # Get NFTs grouped by collection
Tokens
GET /tokens                                                  # Get a list of tokens
GET /tokens/{address_hash}                                   # Get token details
GET /tokens/{address_hash}/transfers                         # Get token transfers
GET /tokens/{address_hash}/holders                           # Get token holders
GET /tokens/{address_hash}/counters                          # Get token statistics
GET /tokens/{address_hash}/instances                         # Get NFT instances
GET /tokens/{address_hash}/instances/{id}                    # Get NFT instance by ID
GET /tokens/{address_hash}/instances/{id}/transfers          # Get NFT instance transfers
GET /tokens/{address_hash}/instances/{id}/holders            # Get NFT instance holders
GET /tokens/{address_hash}/instances/{id}/transfers-count    # Get NFT transfer count
PATCH /tokens/{address_hash}/instances/{id}/refetch-metadata # Re-fetch NFT metadata
Smart contracts
GET /smart-contracts                                     # Get verified smart contracts
GET /smart-contracts/{address_hash}                      # Get smart contract details
GET /smart-contracts/{address_hash}/methods-read         # Get read methods of a smart contract
GET /smart-contracts/{address_hash}/methods-write        # Get write methods of a smart contract
POST /smart-contracts/{address_hash}/query-read-method   # Query a smart contract's read method
Statistics & charts
GET /stats                                               # Get statistics counters
GET /stats/charts/transactions                           # Get transactions chart
GET /stats/charts/market                                 # Get market chart
Other endpoints
GET /config/json-rpc-url                                 # Get JSON-RPC URL
GET /withdrawals                                         # Get withdrawals
GET /proxy/account-abstraction/status                    # Get account abstraction indexing status
Schemas
Blockscout provides multiple schemas representing different blockchain data structures, including: Block, Transaction, TokenTransfer, InternalTransaction, SmartContract, NFTInstance, TokenInfo, and TransactionSummary.
Last Updated: 8 months ago
Json rpc & eth compatible rpc endpoints
In addition to custom RPC endpoints, the Blockscout ETH RPC API supports most commonly used methods in the exact format specified for Ethereum nodes, as per the Ethereum JSON-RPC Specification. These methods are provided for convenience and are most suitable as a fallback option in your JSON RPC API providers. For other use cases, REST or custom RPC methods are recommended.
Supported methods
eth_blockNumber                  # Returns the latest block number in the chain in hexadecimal format
eth_getBalance                   # Returns the balance of a given address in wei
eth_getLogs                      # Returns an array of logs matching a specified filter object
eth_gasPrice                     # Returns the current gas price
eth_getTransactionByHash         # Retrieves a transaction by its hash
eth_getTransactionReceipt        # Retrieves the receipt of a transaction
eth_chainId                      # Returns the chain ID
eth_maxPriorityFeePerGas         # Returns the maximum priority fee per gas
eth_getTransactionCount          # Returns the number of transactions sent from an address
eth_getCode                      # Returns the code at a given address
eth_getStorageAt                 # Returns the value from a storage position at a given address
eth_estimateGas                  # Estimates the gas needed for a transaction
eth_getBlockByNumber             # Retrieves a block by number
eth_getBlockByHash               # Retrieves a block by hash
eth_sendRawTransaction           # Sends a raw transaction
eth_call                         # Executes a new message call immediately without creating a transaction
Graphql in blockscout
The Graph is a decentralized protocol for indexing and querying blockchain data, making it easier to access and use. It acts like a librarian for blockchain data, organizing it for quick retrieval. It decentralizes the reading layer, ensuring reliability and security by avoiding single points of failure. Subgraphs are custom databases within The Graph that define how to collect, organize, and store data from blockchain smart contracts. They make data queryable via GraphQL, simplifying access to complex information like NFT transfer histories. Blockscout integrates with The Graph to enhance its data querying capabilities. Subgraphs can be created to index data from EVM chains supported by Blockscout, such as Ethereum or Sepolia. Once deployed to The Graph's network, which includes over 450 indexers worldwide, this data can be queried efficiently using GraphQL. This integration allows developers to combine Blockscout's detailed blockchain exploration with The Graph's powerful indexing and querying, enabling more advanced dApp development.
What is graphql?
GraphQL is an open-source data query and manipulation language for APIs, and a runtime for fulfilling queries with existing data. It provides an efficient, powerful, and flexible approach to developing web APIs. It allows clients to define the structure of the data required, and exactly the same structure of the data is returned from the server, preventing excessively large amounts of data from being returned.
Key concepts of graphql
- Hierarchical: Queries are structured hierarchically, allowing nested data retrieval.
- Strongly Typed: Schemas define types for all data, ensuring predictable responses.
- Client-Specified Queries: Clients can request exactly the data they need, reducing over-fetching or under-fetching.
Advantages of graphql
- Declarative Integration on Client: Clients specify what data/operations they need.
- Standard Way to Expose Data and Operations: Provides a consistent API structure.
- Support for Real-Time Data: Enables real-time updates with subscriptions.
Query types
There are three main query types in a GraphQL schema:
- Query: Fetch data, such as retrieving posts or transactions.
- Mutation: Change data, such as updating a post or modifying a record.
- Subscription: Subscribe to real-time data, such as new posts in a category.
Access graphql api
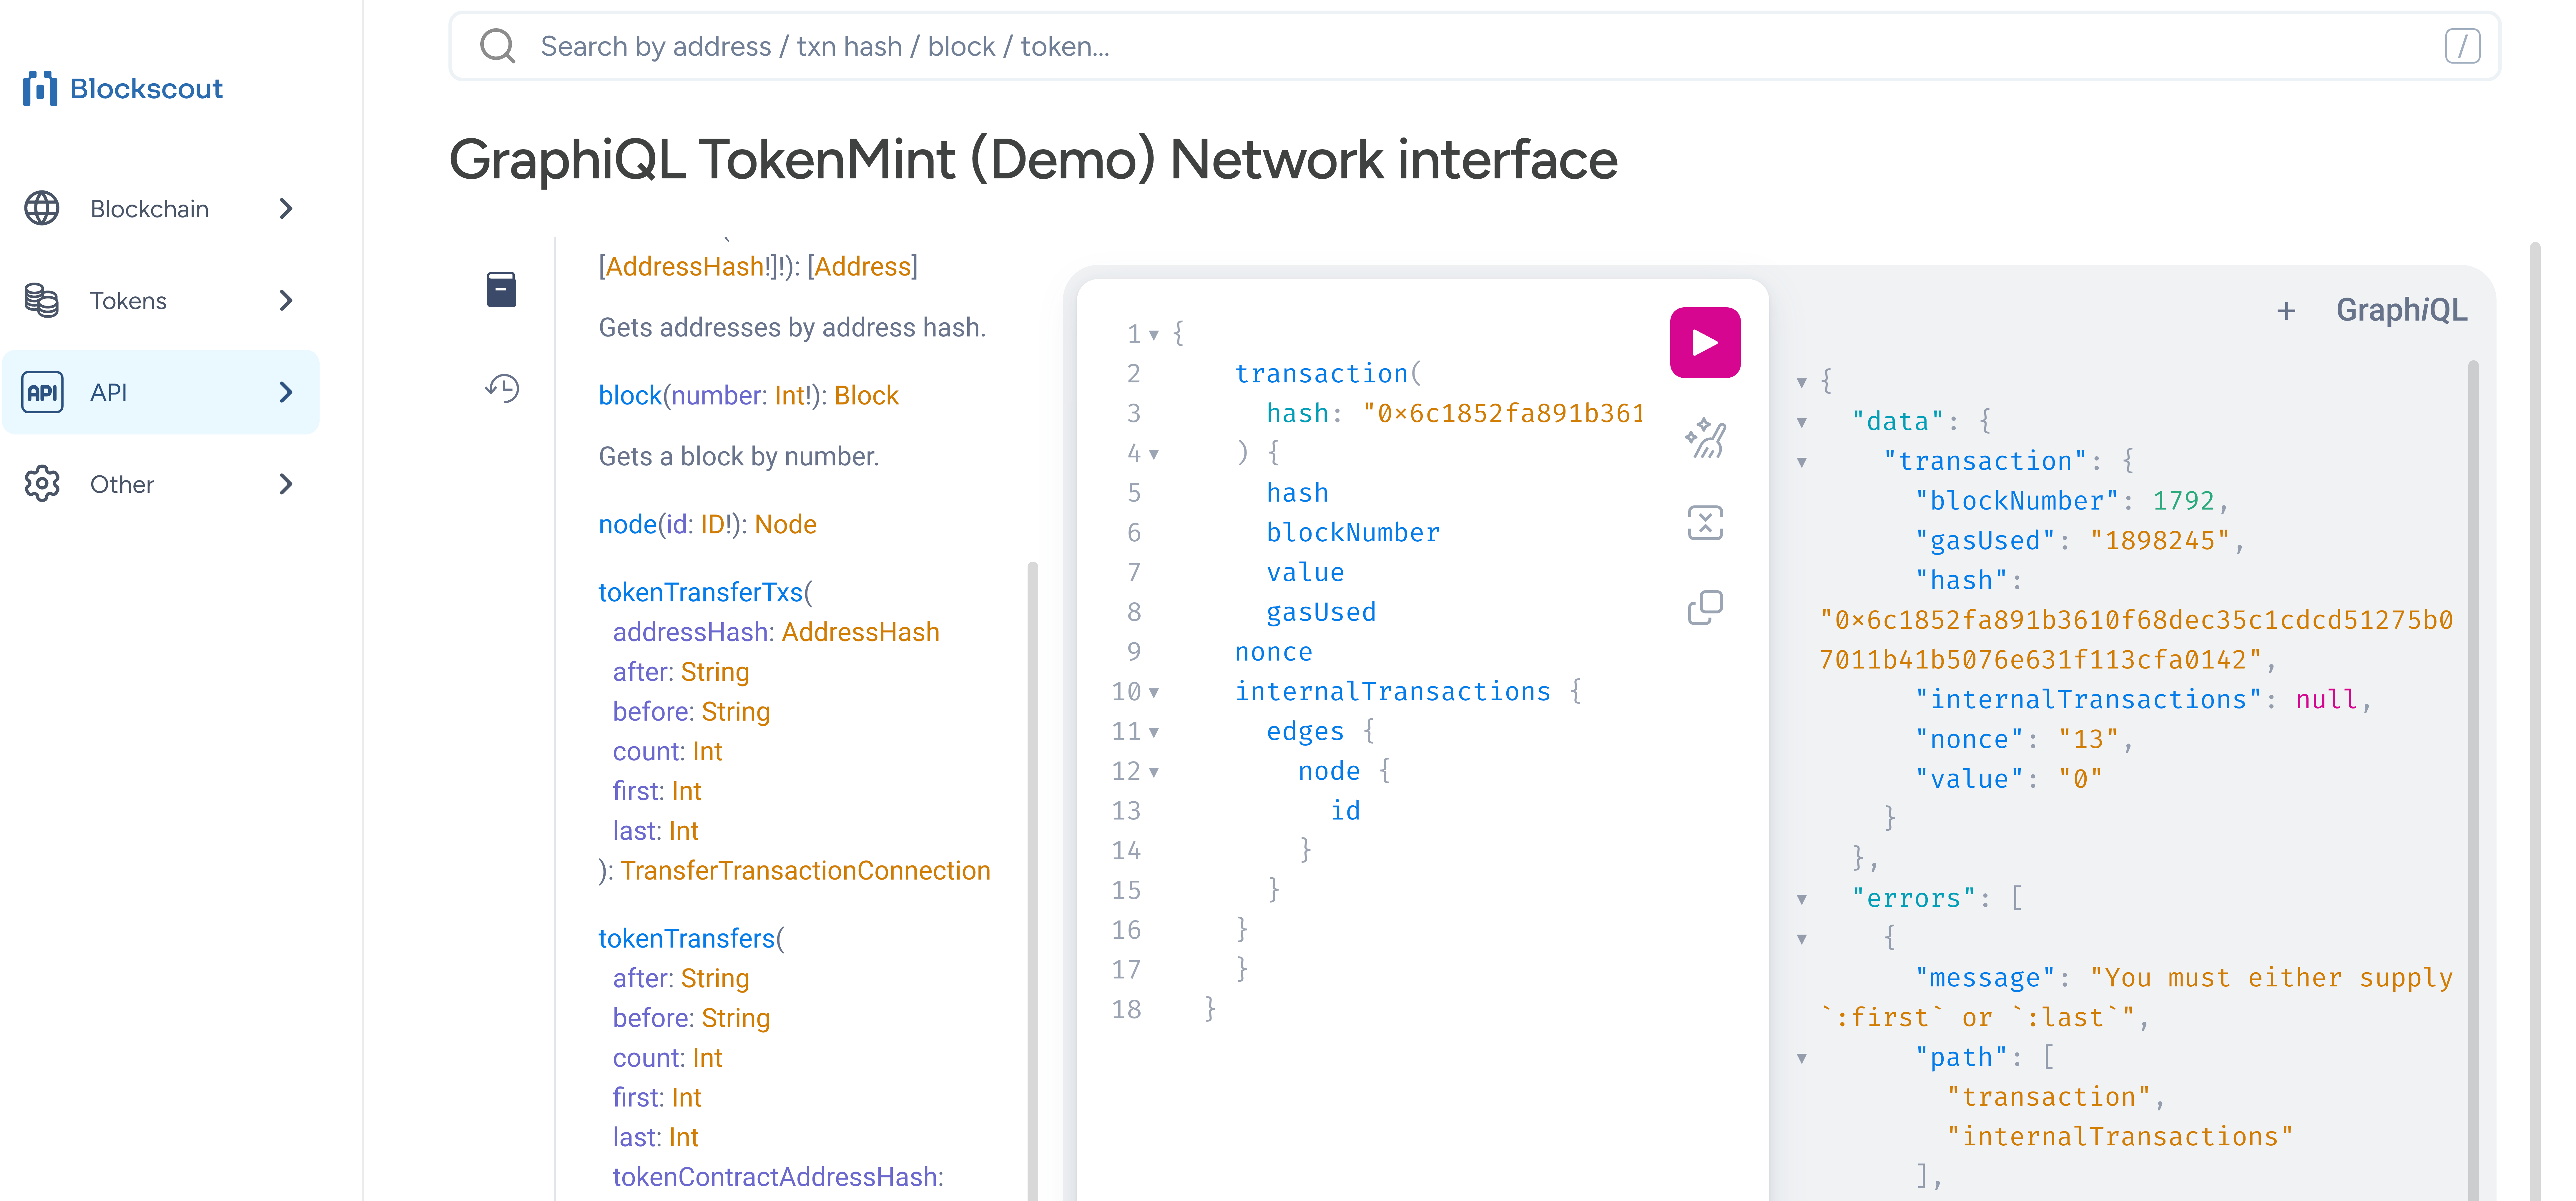
To access Blockscout's GraphQL interface, use GraphiQL, an in-browser IDE for exploring GraphQL, which is built into Blockscout. From the APIs dropdown menu, choose GraphQL. Alternatively, you can use your favorite HTTP client to send requests to the GraphQL endpoint.
Graphiql interface
The GraphiQL interface provides a user-friendly environment to explore and test GraphQL queries. It includes a documentation explorer (Docs section) that provides schema details, such as root types, and a query editor to write and execute queries.
Queries
Blockscout's GraphQL API provides queries and a subscription, viewable in the GraphQL interface under the Docs menu. Example queries include:
address(hash: AddressHash!): Address           # Gets an address by hash
addresses(hashes: [AddressHash!]): [Address]   # Gets addresses by hashes
block(number: Int!): Block                     # Gets a block by number
transaction(hash: FullHash!): Transaction      # Gets a transaction by hash
Example query to retrieve transactions for a specific address
{
  address(hash: "0xaddressHash") {
    transactions(first: 10) {
      edges {
        node {
          blockNumber
          createdContractAddressHash
          fromAddressHash
          gas
          hash
        }
      }
    }
  }
}
Why is Hyperledger Explorer essential for Fabric networks?
For Enterprise Fabric Networks: Hyperledger Explorer provides comprehensive network visibility, enabling administrators to monitor consortium activities, track chaincode performance, and ensure compliance across multiple organizations.
Hyperledger Explorer is a web-based tool designed to provide comprehensive and real-time visibility into Hyperledger Fabric networks. For enterprise consortiums, it enables:
- Multi-organization monitoring across entire consortium networks
- Chaincode performance tracking for optimizing smart contract execution
- Channel-specific analytics ensuring proper access control and privacy
- Compliance reporting for regulatory requirements in consortium environments
- Real-time alerting for critical network events and anomalies
Network Monitoring
- Real-time block and transaction tracking
- Peer and orderer health monitoring
- Consensus performance metrics
- Channel activity visualization
Consortium Management
- Multi-organization activity tracking
- Permission and access monitoring
- Inter-org transaction analysis
- Governance compliance reporting
Performance Analytics
- Chaincode execution metrics
- Transaction throughput analysis
- Resource utilization tracking
- Bottleneck identification
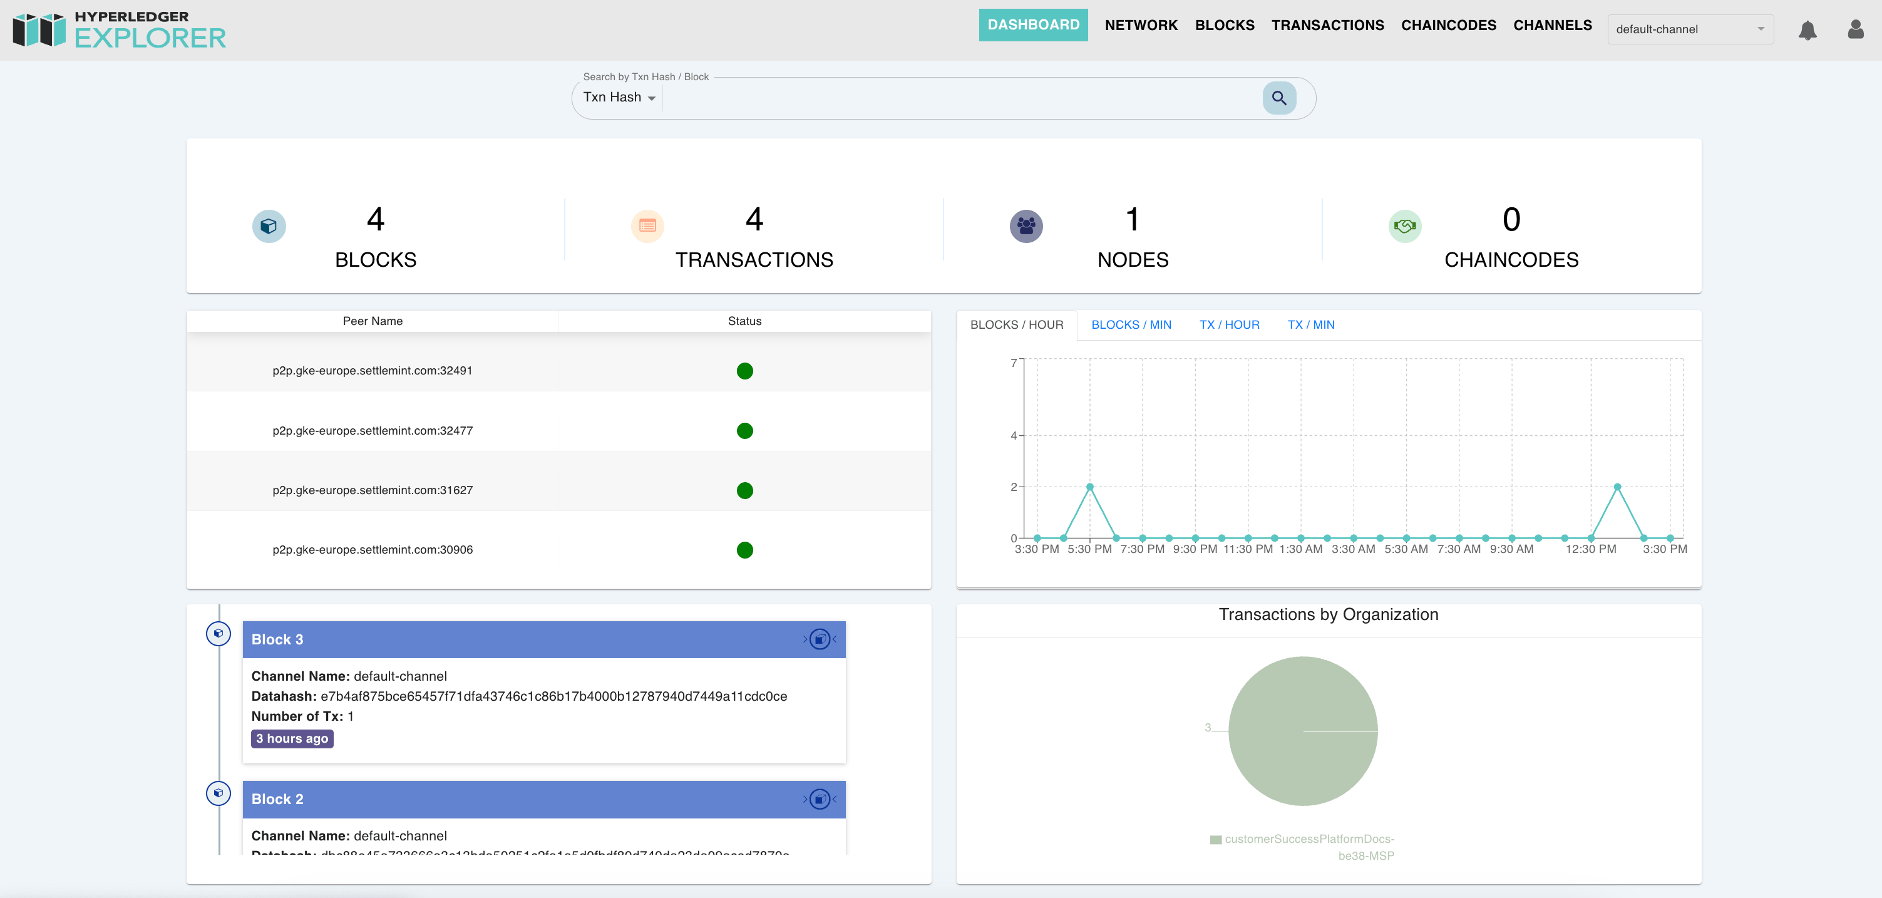
- Real-time Monitoring: Displays network activity as it happens, providing immediate visibility into new blocks and transactions.
- Comprehensive Dashboard: A central hub for monitoring network health, including metrics such as the number of blocks, transactions, nodes, and chaincodes.
- Detailed Block & Transaction Views:
- Block list with metadata such as block hash, transaction count, and timestamps.
- Transaction explorer for tracking transaction details, types, and associated metadata.
- Search & Filtering:
- Filter transactions and blocks by date range, channel, or organization.
- Advanced sorting capabilities for customized data views.
- Channel & Chaincode Management:
- View and manage available channels.
- Display installed chaincodes with versioning details.
- Interactive Metrics & Analytics:
- Graphical visualizations of blockchain activity.
- Hover-based insights for precise data analysis.
How do I navigate the Fabric Explorer dashboard?
Best Practice: Use the channel selector to focus on specific business processes within your consortium. Each channel represents a separate business workflow with its own privacy and access controls.
The Enterprise Dashboard serves as your central command center for consortium network monitoring:
Select Business Channel
Use the channel dropdown to focus on specific business processes or organizational partnerships
Monitor Network Health
Review peer status, orderer performance, and overall network connectivity in real-time
Track Recent Activity
Analyze recent transactions by organization to understand consortium participation patterns
Investigate Issues
Click on any block or transaction for detailed forensic analysis and debugging
Key Dashboard Metrics:
- Block Height - Current network state across all channels
- Transaction Volume - Business activity levels by organization
- Peer Health - Infrastructure status for each consortium member
- Chaincode Performance - Smart contract execution efficiency
- Organization Activity - Participation levels and transaction patterns
Network & channel management
The Network View presents details on configured properties for each channel. Users can analyze peer statuses, their roles, and network configurations, including ledger height and Membership Service Provider (MSP) identity.
The Channel List section provides an overview of available channels, enabling users to navigate different segments of the blockchain network effortlessly.
Exploring blocks & transactions
Hyperledger Explorer provides powerful tools for tracking blockchain activities:
- Block List: A sortable, filterable table displaying block metadata like block hash, transaction count, and creation timestamps.
- Transaction List: Supports up to 100 rows per page with pagination and allows users to drill down into transaction specifics.
- JSON Transaction Views: Enables structured previews with fold/unfold options for easy data inspection.
Chaincodes & smart contracts
The Chaincode List presents installed chaincodes across the network, allowing filtering and sorting by:
- Chaincode name
- Version
- Deployment status
- Associated transactions
This section helps users manage smart contracts efficiently and track changes over time.
Analytics & metrics
A dedicated Metrics Panel delivers real-time statistics, such as:
- Number of blocks and transactions processed per hour or minute
- Network activity trends over time
- Interactive charts for monitoring blockchain operations
These visual analytics tools enhance user insights and ensure efficient blockchain monitoring.
Load Balancer
Complete guide to blockchain load balancing for enterprise applications. Learn to distribute traffic across nodes, ensure 99.9% uptime, and optimize performance with SettleMint's intelligent load balancing.
Code Studio
Complete guide to SettleMint's Code Studio - a web-based VS Code IDE for blockchain development. Deploy smart contracts, build dApps, and collaborate on blockchain projects with pre-configured tools and templates.